When 0.8 should really mean 80%
A model can rank every alert in the right order and still lie about how sure it is. Here is how to catch it with nothing but grouping and counting, and the fixes that work.

The 60-second version Open
- A model is calibrated when its 80% happens about 80% of the time. You can check that by grouping and counting.
- Ranking and honesty are different things. Two models with the same AUC of 0.888 had calibration errors of 0.008 and 0.268.
- Rebalancing the training data to 50/50 is the most common way teams break calibration without noticing.
- Platt scaling fixes it with two numbers. Temperature scaling can't fix a wrong base rate.
- Check calibration inside every group you act on. An overall error of 0.005 hid endpoint alerts scored at 6.8% that were really 10.4%.
Here's a question that sounds silly until it costs you money: if a model says 80%, does that mean 80%?
Your instinct is probably "obviously". It's a probability; that's what the number is for. But a number is just a number. A model can say 0.8 about alerts that turn out to be attacks half the time, or nineteen times out of twenty. Nothing in the maths forces its 0.8 to line up with reality. It lines up only if the model was built well, trained on the right data and checked. And even then it can drift.
The weather forecaster's secret
People love to complain about weather forecasters. But when researchers in the 1970s checked American forecasters against years of their own forecasts, they found something remarkable. When the forecasters said "30% chance of rain", it rained on roughly 30% of those days. When they said 70%, it rained roughly 70% of the time.
Compare that with the rest of us. Ask someone for a range they're "90% sure" contains the answer to a trivia question, and the truth lands inside far less often than nine times in ten. As a species, we are reliably too sure of ourselves.
A model is calibrated when its 80% happens about 80% of the time.
The forecasters weren't always right. Nobody can be. What made them good is that their numbers meant what they said. And that is something you can check, with nothing more than grouping and counting.
Good at ranking, bad at honesty
Before checking anything, one idea needs to land, because people confuse it constantly. There are two separate things you might want from a model's probabilities.
The first is ranking: does the model give attacks higher numbers than harmless alerts? If you sort alerts by score, do the real attacks rise to the top? That's what AUC measures. An AUC of 1 means every attack scored above every harmless alert; 0.5 means the scores are no better than a coin flip.
The second is honesty: when the model says 0.3, do three in ten of those alerts turn out to be attacks? That's calibration. The two are independent. A model can rank perfectly and still lie about how sure it is.
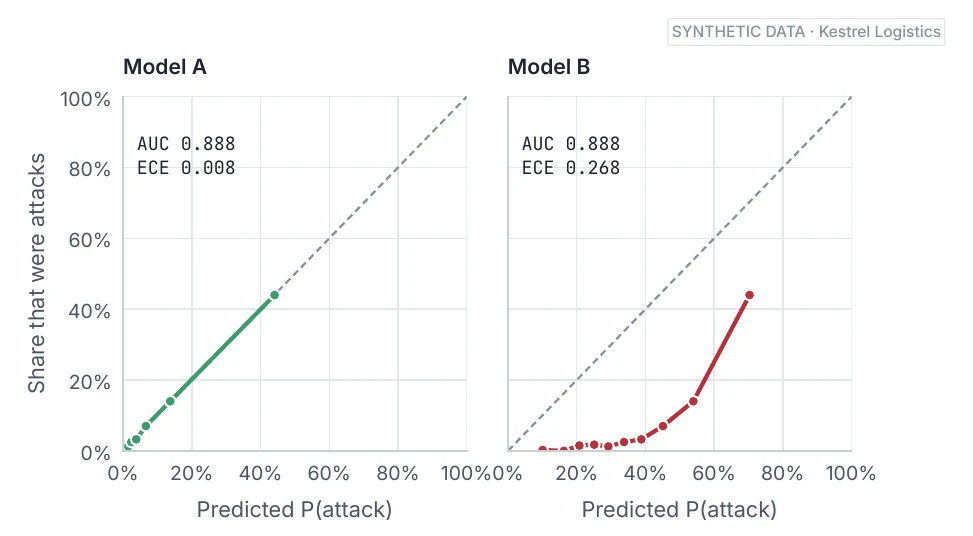
If you only ever sort alerts, Model B is as good as Model A. The moment you put a threshold on its numbers, add them into a cost, or show them to an analyst, it will mislead you. Most leaderboards report ranking metrics like AUC, accuracy or F1. Calibration is often not measured at all, and for a decision system it's usually the thing that matters most.
How to check: group and count
You check calibration exactly the way the weather researchers did. Take predictions where you know what happened. Sort them into bins by what the model said: 0 to 10%, 10 to 20%, and so on. In each bin, compare the model's average prediction with the share that really were attacks. Plot one against the other, and you have a reliability diagram.
bins = np.clip((p * 10).astype(int), 0, 9)
table = (pd.DataFrame({{"bin": bins, "said": p, "happened": y}})
         .groupby("bin")
         .agg(said=("said", "mean"), happened=("happened", "mean"),
              n=("said", "size")))
print(table.round(3).head(4))Read the last column first. The bottom bins hold thousands of alerts and line up closely. Higher up, a bin with 87 alerts drifts, and a wobbly dot with a dozen alerts behind it is weak evidence. Always look at the counts before you panic, or relax.
When you need one number, use the ECE. This model's is 0.008: on average its probabilities are off by less than one percentage point. Model B's is 0.27. But ECE depends on how you choose the bins, and because it's an average, a model can hide bad calibration in a small corner behind good calibration where most of the data sits. Report it, and always look at the picture too.
The well-meant mistake that breaks it
The most common way teams break calibration starts with good intentions. Attacks are rare, only 8% of Kestrel's alerts, so someone decides the model needs to "see more attacks" and trains it on a 50/50 mix: every attack, plus an equal number of randomly chosen harmless alerts.
The ranking survives. But the model has learned that attacks are about ten times more common than they are, and every probability it gives comes out far too high. Its calibration error jumps to 0.216.
The other usual suspects: scores that were never trained as probabilities in the first place; very large neural networks, which tend to come out overconfident; and the world changing, so that a model calibrated on last month's base rate is wrong the day a campaign doubles the attacks.
Fixing it, without retraining
Here's the good news: a model with good ranking and bad calibration is usually easy to fix. You don't retrain it. You hold back a calibration set the model never trained on, and fit a small correction on top that maps its raw probabilities to honest ones. Then you check the result on a test set that neither has seen.
Platt scaling fits a tiny logistic regression on the model's log-odds: two numbers, a stretch and a shift. It's the one to reach for first. Isotonic regression fits any rising staircase; it can fix almost any shape, but it needs more data and can overfit a small calibration set.
Temperature scaling, the standard fix for overconfident neural networks, didn't help at all. The reason teaches you something. Rebalancing didn't make the model overconfident; it shifted every prediction upwards, as if attacks were common. A temperature can only stretch or squeeze predictions around the middle. It can't slide them all down.
Temperature fixes overconfidence. It can't fix a wrong base rate.
One essay a week on building AI that decides, with the code. Free.
Honest on average, dishonest in the corner
One more trap, and it's the one that bites in production. A model can be well calibrated overall and badly calibrated for a particular group. Here is a version of Kestrel's model trained without knowing which detection tool raised each alert.
Its overall calibration error is excellent: 0.005. Yet for endpoint alerts it says 6.8% when the truth is 10.4%, and for data-loss alerts it says 7.7% when the truth is 4.8%. If Kestrel auto-closes any alert under 3%, real endpoint threats get closed without review about half as often again as planned, while the queue fills with harmless data-loss alerts.
Check calibration inside every group you'll act on differently, and every group where a mistake would be especially costly.
Sources, customer tiers, languages, regions, and demographic groups whenever a model touches people's lives. You can fix it in the model, by giving it the group as a feature or calibrating each group separately, or in the policy, with a stricter line for the group it gets wrong. The first is better. The second is quicker.
What calibration can't tell you
Calibration is measured on some data, and it's only guaranteed for data like that. It drifts as tools, attackers and people change. And it says nothing about any single prediction: a perfectly calibrated 70% is still wrong three times in ten. So keep a fresh calibration set, refit on a schedule, and keep looking at the diagram.
"The first principle is that you must not fool yourself, and you are the easiest person to fool." Richard Feynman, 1974
Every threshold, every cost line and every claim about a model's numbers rests on this one habit. It's the cheapest check in machine learning, and the one most often skipped.
Next in the letter: Your LLM's 0.95 isn't a probability.
Discussion